Using Human Mobility Data to Detect Evacuation Patterns in Hurricane Ian
14 Apr 2024Authors: Xiang Li, Yi Qiang, Guido Cervone
1. The highlight of this article
- Generate a framework to use human mobility data to detect hurricane evacuation patterns
- Examine the spatiotemporal patterns and compliance of evacuation orders during Hurricane Ian
2. Study area and dataset
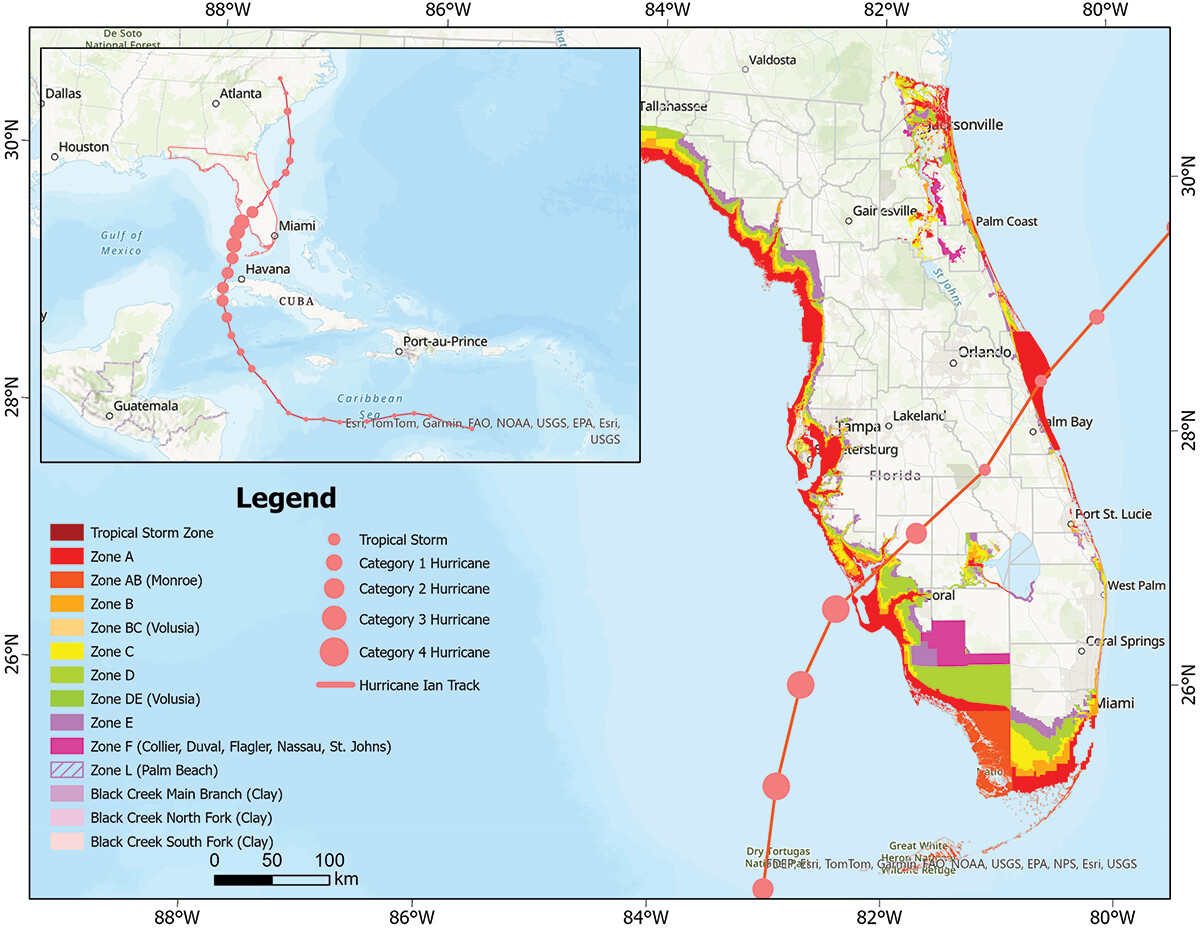
We detected the evacuation patterns in census block group and county level originating from Florida.
For the dataset, we used:
- SafeGraph Weekly Pattern Data: SafeGraph collects the home CBGs of users by analysing users’ most common night-time locations during the last six weeks. By linking visited POIs with their originating CBGs, we can analyse the number and origin of unique visitors to each POI throughout a week.
- Census Data: Socio-economic data in zip codes and block groups are acquired from the Census Bureau
- Evacuation Zones Data: The evacuation zones are acquired from the Florida Division of Emergency Management
3. Methods
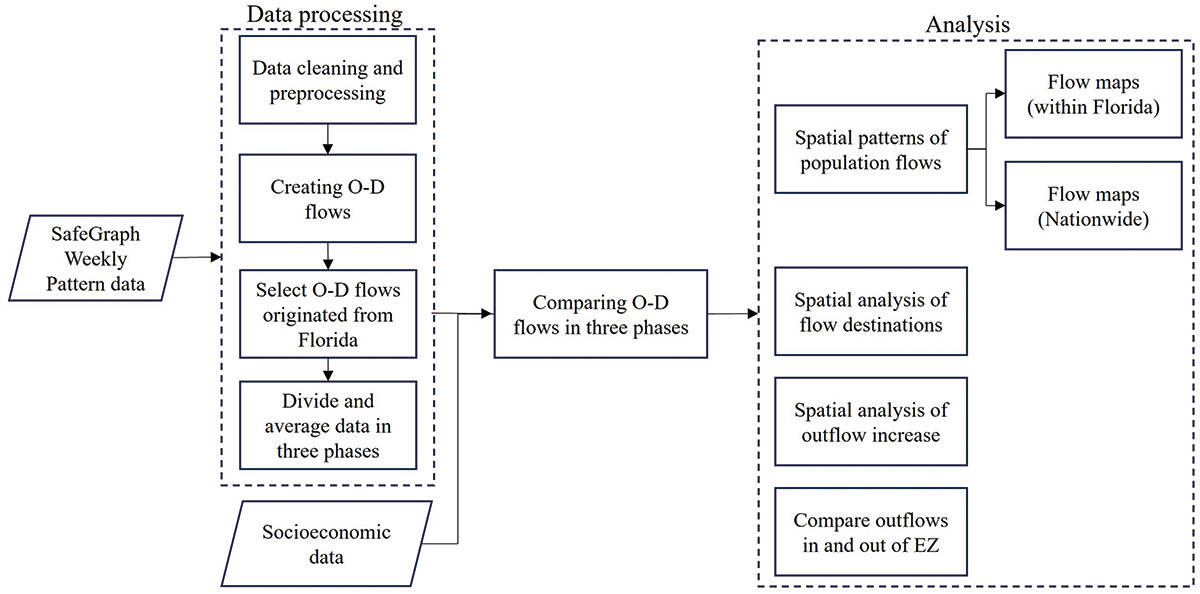
The analysis of evacuation patterns during Hurricane Ian employs a structured analytical workflow designed to capture and interpret large-scale human mobility data. The workflow begins by defining the study period, which is divided into three distinct phases: the pre-hurricane phases (3 weeks before the landfall), in-hurricane (the week right after the landfall), and post-hurricane (the following week). During these periods, population movements are analyzed both within Florida and beyond, with a particular focus on the areas most affected by the hurricane.
- Spatial analysis of outflows, origins, and destinations First, we created flow maps to visualize net population flows in O-D pairs during the three phases of the hurricane. Second, hot spot analysis was conducted to detect popular destinations for the evacuation. Specifically, we calculated the change ratios of visitors from Florida during the in- and post-hurricane phases in comparison to the baseline in all U.S counties. Third, we analysed the origins of the O-D flows to reveal the spatial variation of the compliance with the evacuation orders in the affected areas. Specifically, we calculated the percent changes of population outflows during the in- and post-hurricane phases compared to the baseline in the twelve counties under mandatory evacuation orders in the hurricane.
4. Results
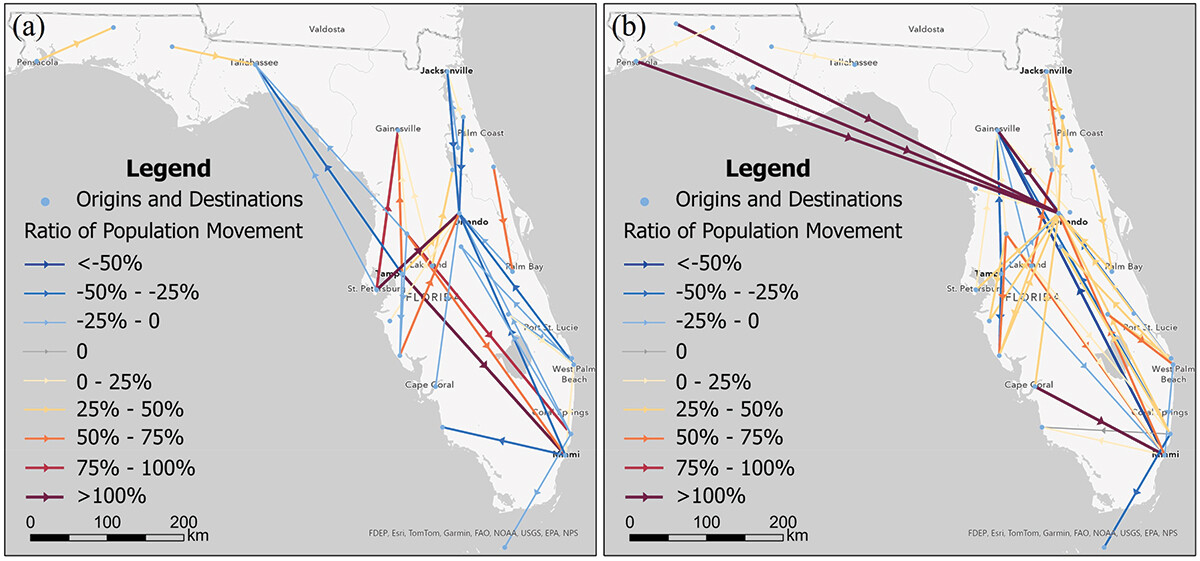
The study revealed distinct spatial patterns of evacuation during Hurricane Ian. Compared to the baseline (pre-hurricane phase), population outflows increased significantly from Florida’s west coast, particularly the Tampa Bay and Fort Myers areas, which were in the direct path of the hurricane.
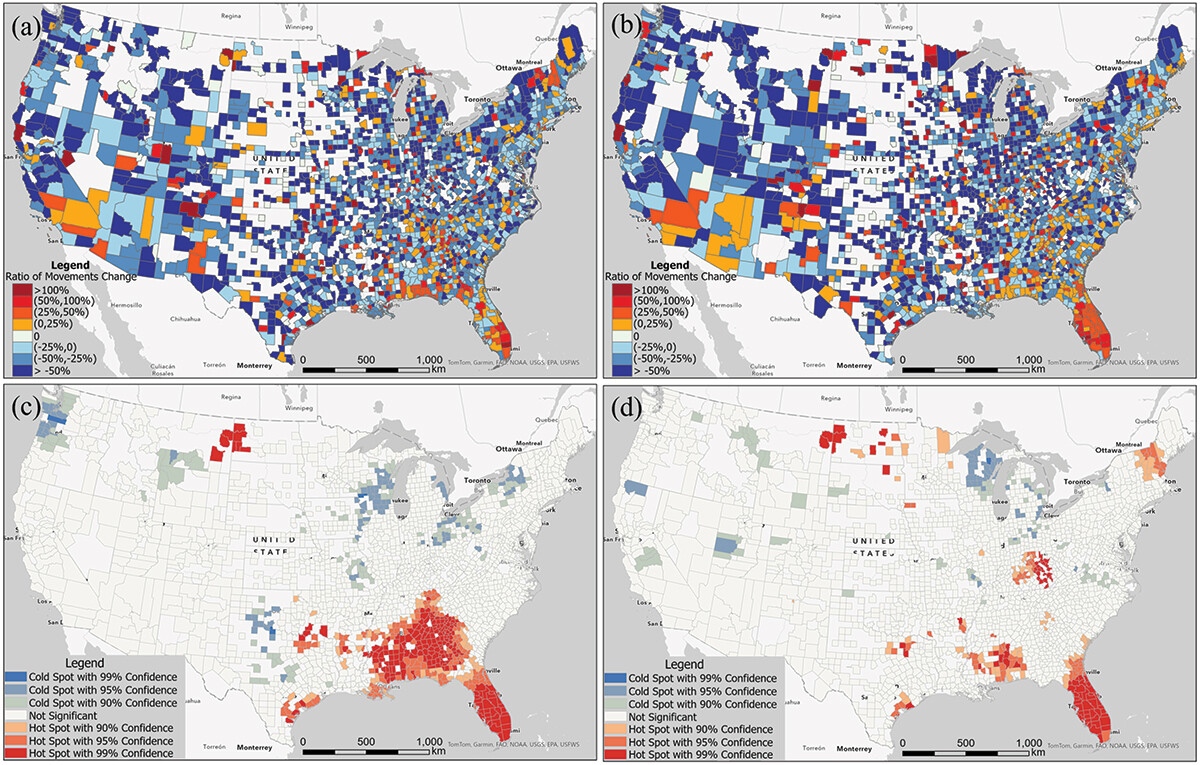
Using hot spot analysis, we detected local clusters of high (hot spots) and low (cold spots) percent changes. Most of travelers chose to move within Florida during the hurricane. In addition to counties within Florida, hot spots of Florida visitors tend to spread toward the northwest neighbor states including Alabama, Georgia, Mississippi, and even as far as Louisiana and Texas.
5. Discussion
(if you have interests, we can cooperate)
- Evacuation patterns differences in different disasters.
- Effect of evacuation order.