Natural disasters and human migration in the United States: Insights from automated machine learning and explainable AI
29 Apr 2026Li, X., Qiang, Y., Huang, X., Zou, L., & Cai, H. (2026). Natural disasters and human migration in the United States: Insights from automated machine learning and explainable AI. Journal of Environmental Management, 406, 129796.
- The highlight of this article
- Research question and data
- Methods
- Key findings
- Contribution and innovation
1. The highlight of this article
This article asks a deceptively simple question: how do repeated natural disasters shape where people move within the United States? Instead of treating disasters as a single shock, the study compares four major hazard types - floods, hurricanes, wildfires, and tornadoes - and examines how disaster frequency, damage, injuries, and fatalities relate to county-level net migration rates from 2000 to 2020.
The key message is that disaster-related migration is not a simple “hazard causes people to leave” process. Counties with higher disaster impacts often show lower average net migration rates, but the association varies by disaster type, intensity, timing, and local socioeconomic context. The study therefore combines statistical modeling with automated machine learning and explainable AI to capture nonlinear and spatially heterogeneous patterns.
2. Research question and data
The study focuses on the contiguous United States and links county-level migration outcomes with four major disaster types. It uses net migration rate (NMR) as the main migration outcome and combines disaster variables with socioeconomic and environmental controls. This design makes it possible to compare disaster effects with more traditional migration drivers such as income, housing conditions, population density, and natural amenities.
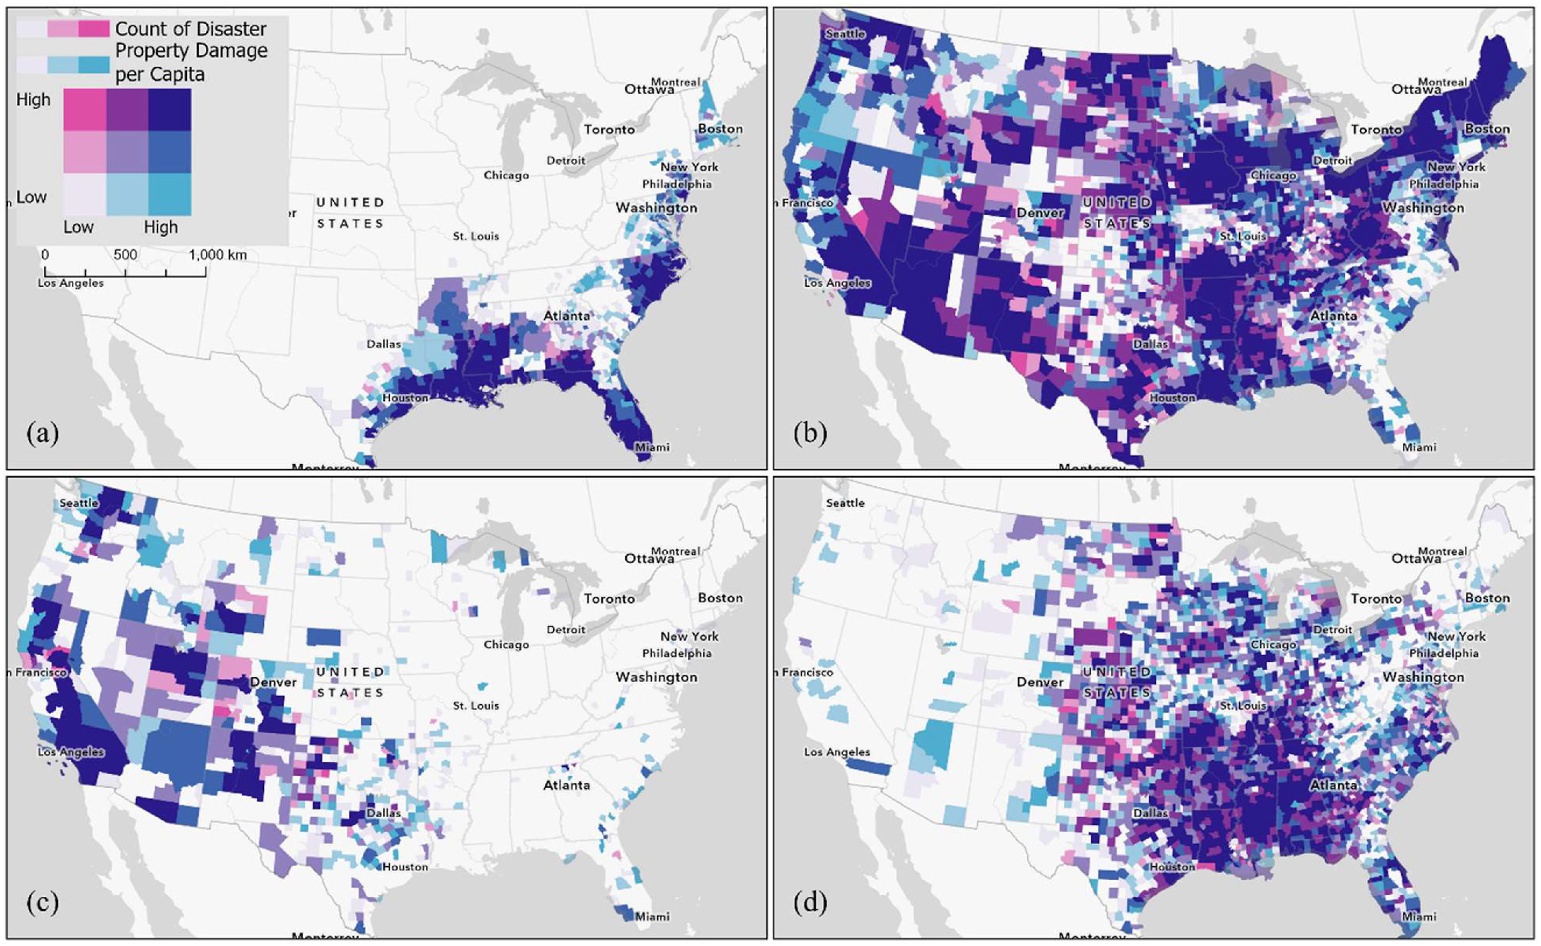
Fig. 1 maps disaster frequency and per-capita property damage. The bivariate maps show why the analysis needs to be hazard-specific: hurricanes concentrate along the Gulf and Atlantic coasts, floods are more widespread, wildfires cluster strongly in the western United States, and tornado impacts are concentrated in the central and southeastern United States.
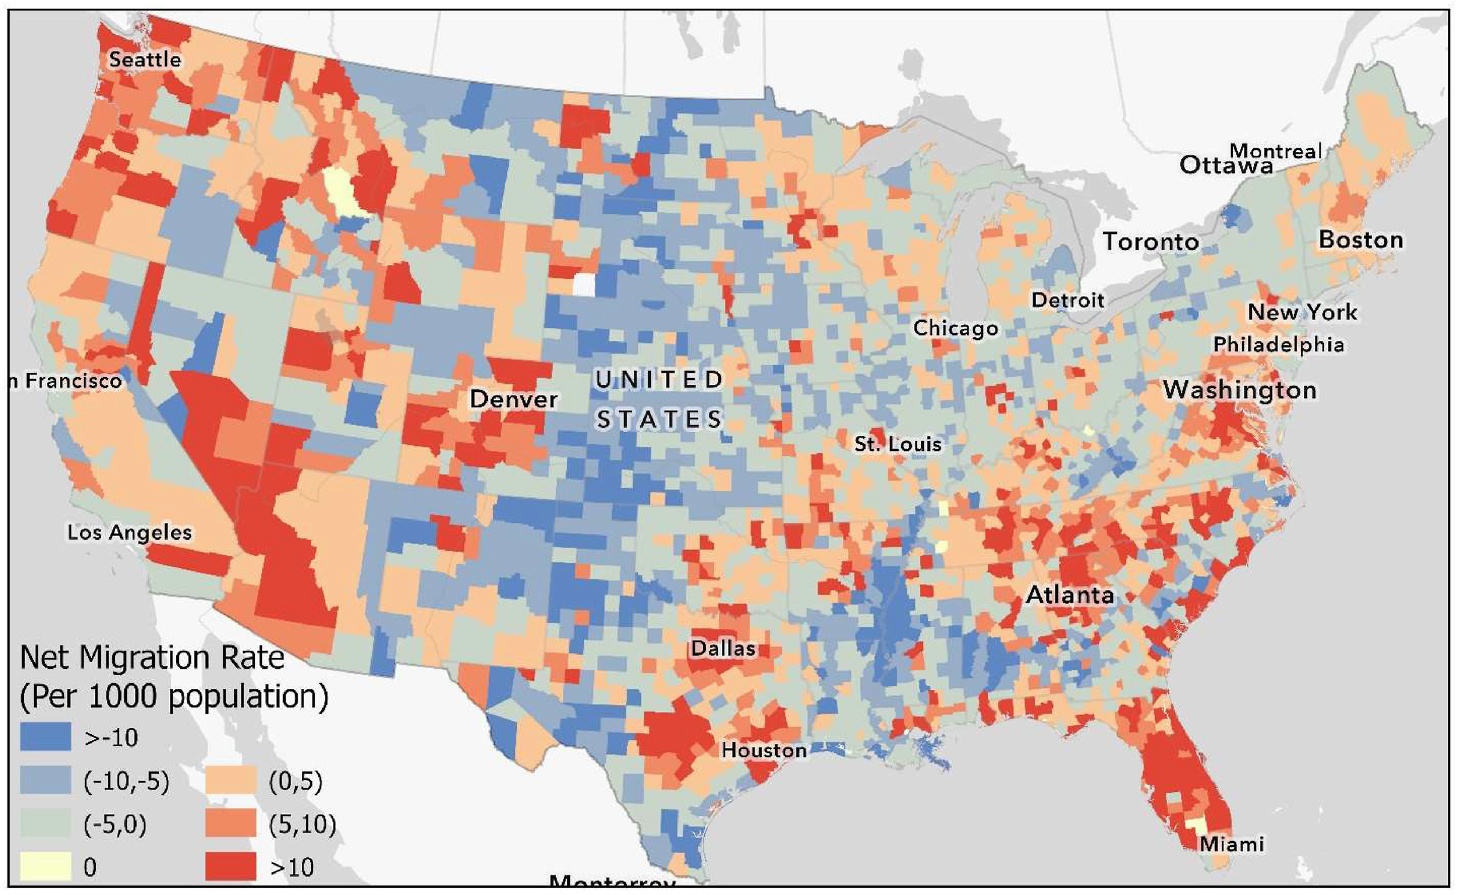
Fig. 2 shows the average net migration rate across counties from 2000 to 2020. The map provides the demographic baseline against which disaster impacts are interpreted. Some high-risk regions still experienced population gains, which is one reason the article argues against a simplistic disaster-migration narrative.
3. Methods
The paper uses three complementary analytical layers.
First, time-series comparisons group counties into high-, moderate-, and low-impact categories for each disaster type. This reveals how migration rates vary over time as disaster-related property damage changes.
Second, Generalized Additive Model (GAM) panel regressions estimate immediate and one-year lagged relationships between disaster variables and NMR. GAM is useful here because the association between disaster exposure and migration may be nonlinear. A low level of disaster frequency may not have the same effect as repeated or cumulative exposure.
Third, an automated machine learning framework evaluates long-term migration prediction. The models are then interpreted with SHapley Additive exPlanations (SHAP), which helps identify which variables matter most and where disaster variables contribute to the prediction.
4. Key findings
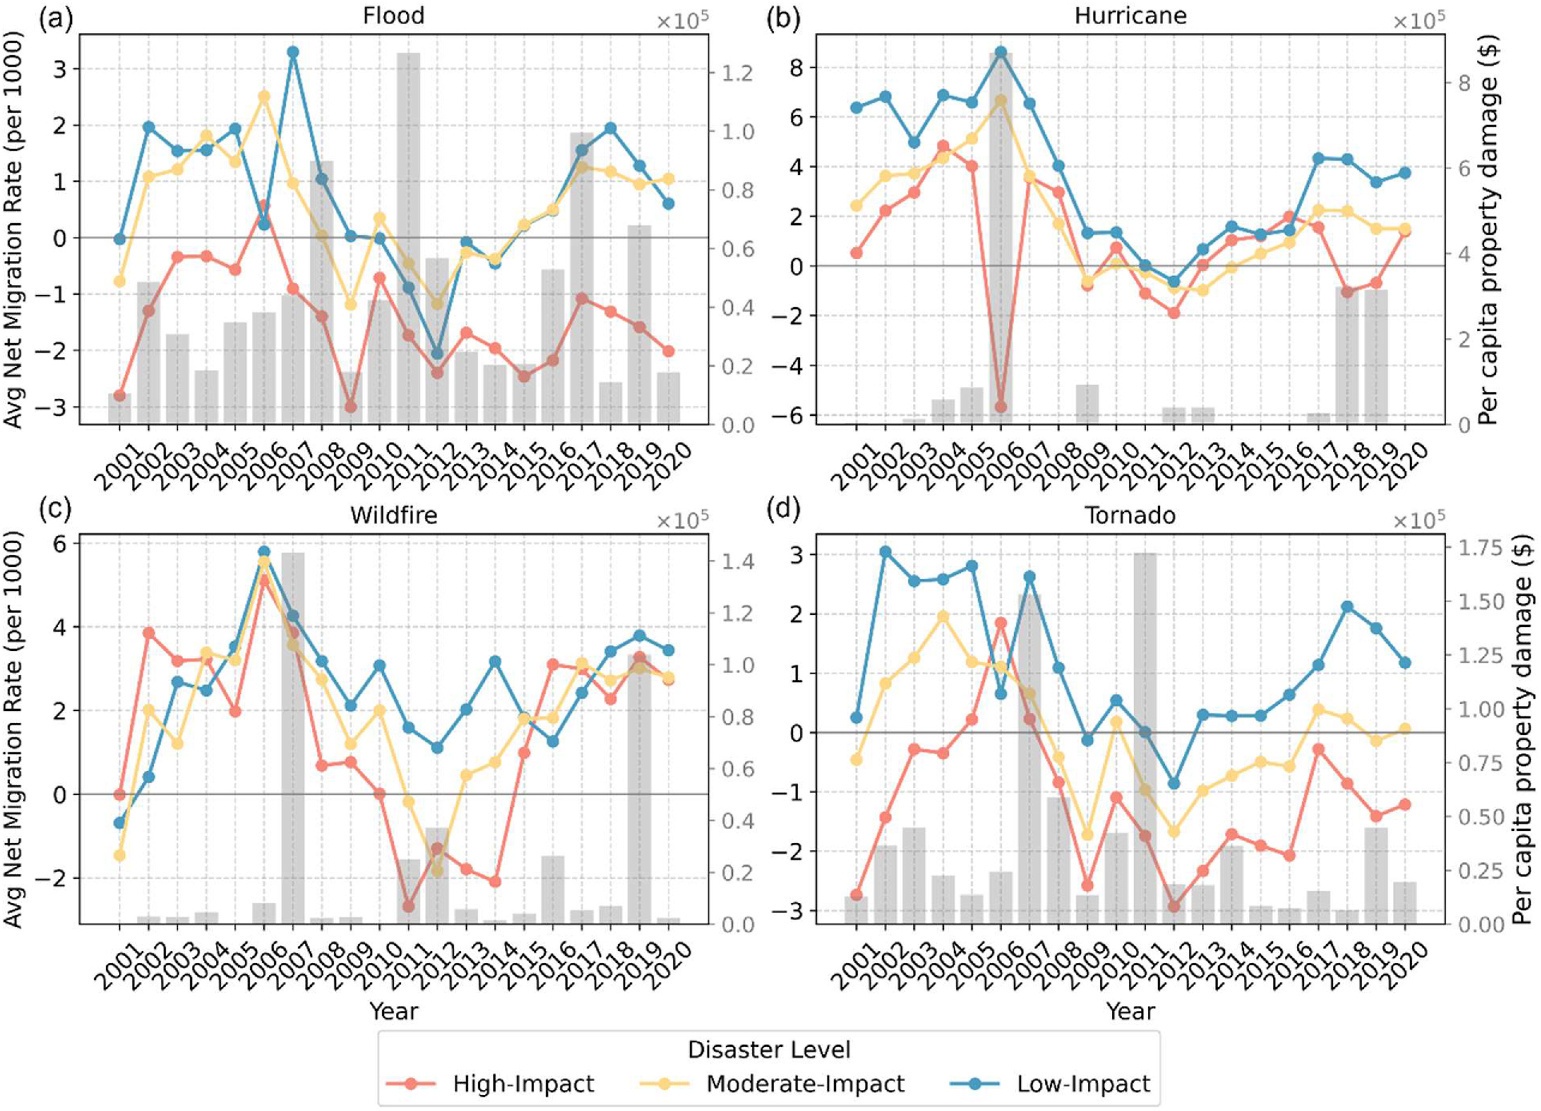
Fig. 3 shows that high-impact counties generally have lower NMR than moderate- and low-impact counties, although the timing and magnitude differ by hazard. Floods and tornadoes show especially clear contrasts among impact groups. Hurricane-related migration patterns are more event-sensitive, with visible changes around major years such as 2005 and 2017.
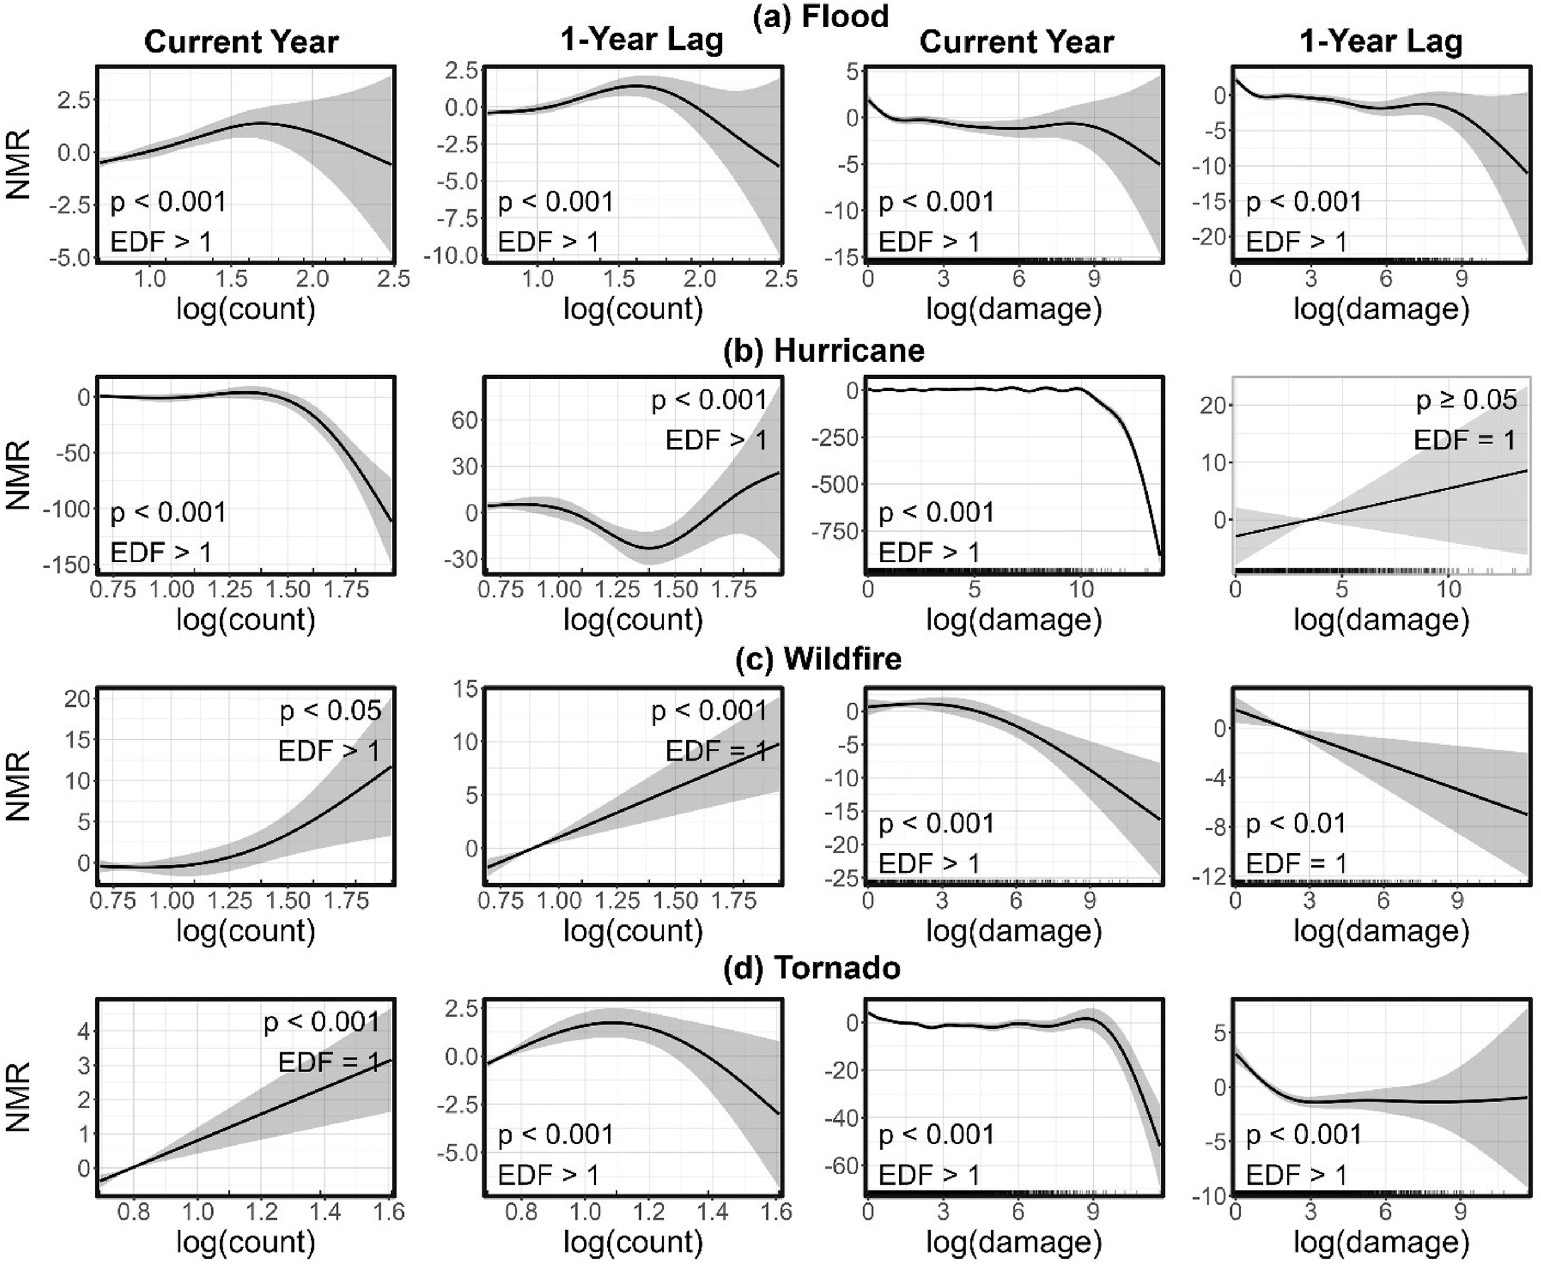
Fig. 4 highlights the nonlinear relationships captured by GAM. Some disaster variables show threshold-like behavior: migration responses may remain weak at lower levels of exposure but become more negative once disaster frequency or damage passes certain levels. This is important because linear models can miss tipping-point-like effects.
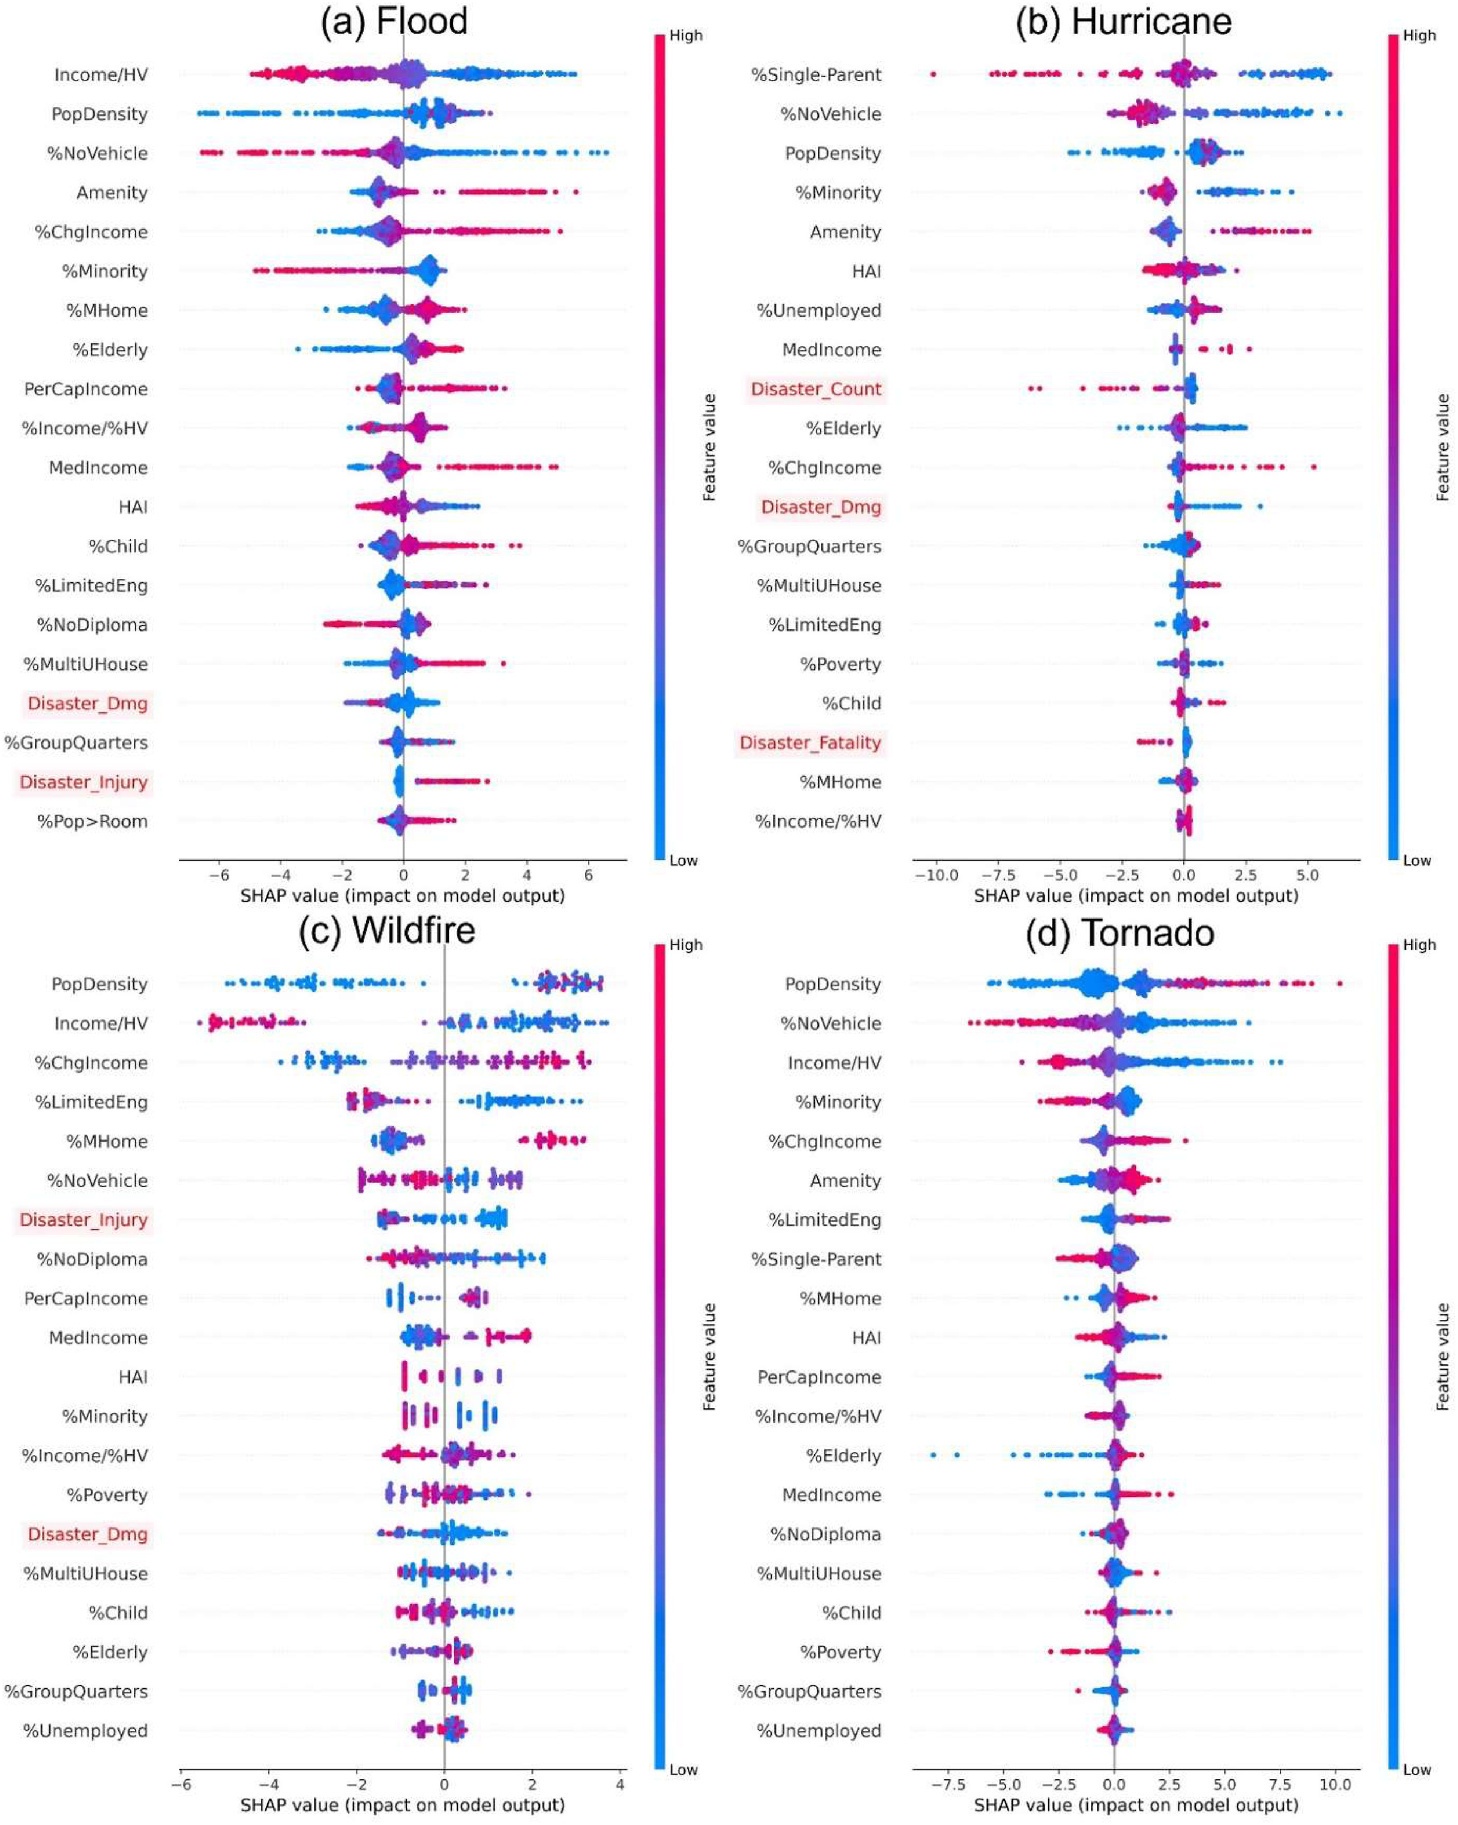
Fig. 5 ranks the top predictors in the AutoML models. Socioeconomic variables remain dominant across hazard types, especially population density, income-housing relationships, vehicle access, and demographic characteristics. Disaster variables still appear among influential predictors, particularly for hurricanes, wildfires, and tornadoes. This supports the interpretation that disasters interact with socioeconomic conditions rather than replacing them as migration drivers.
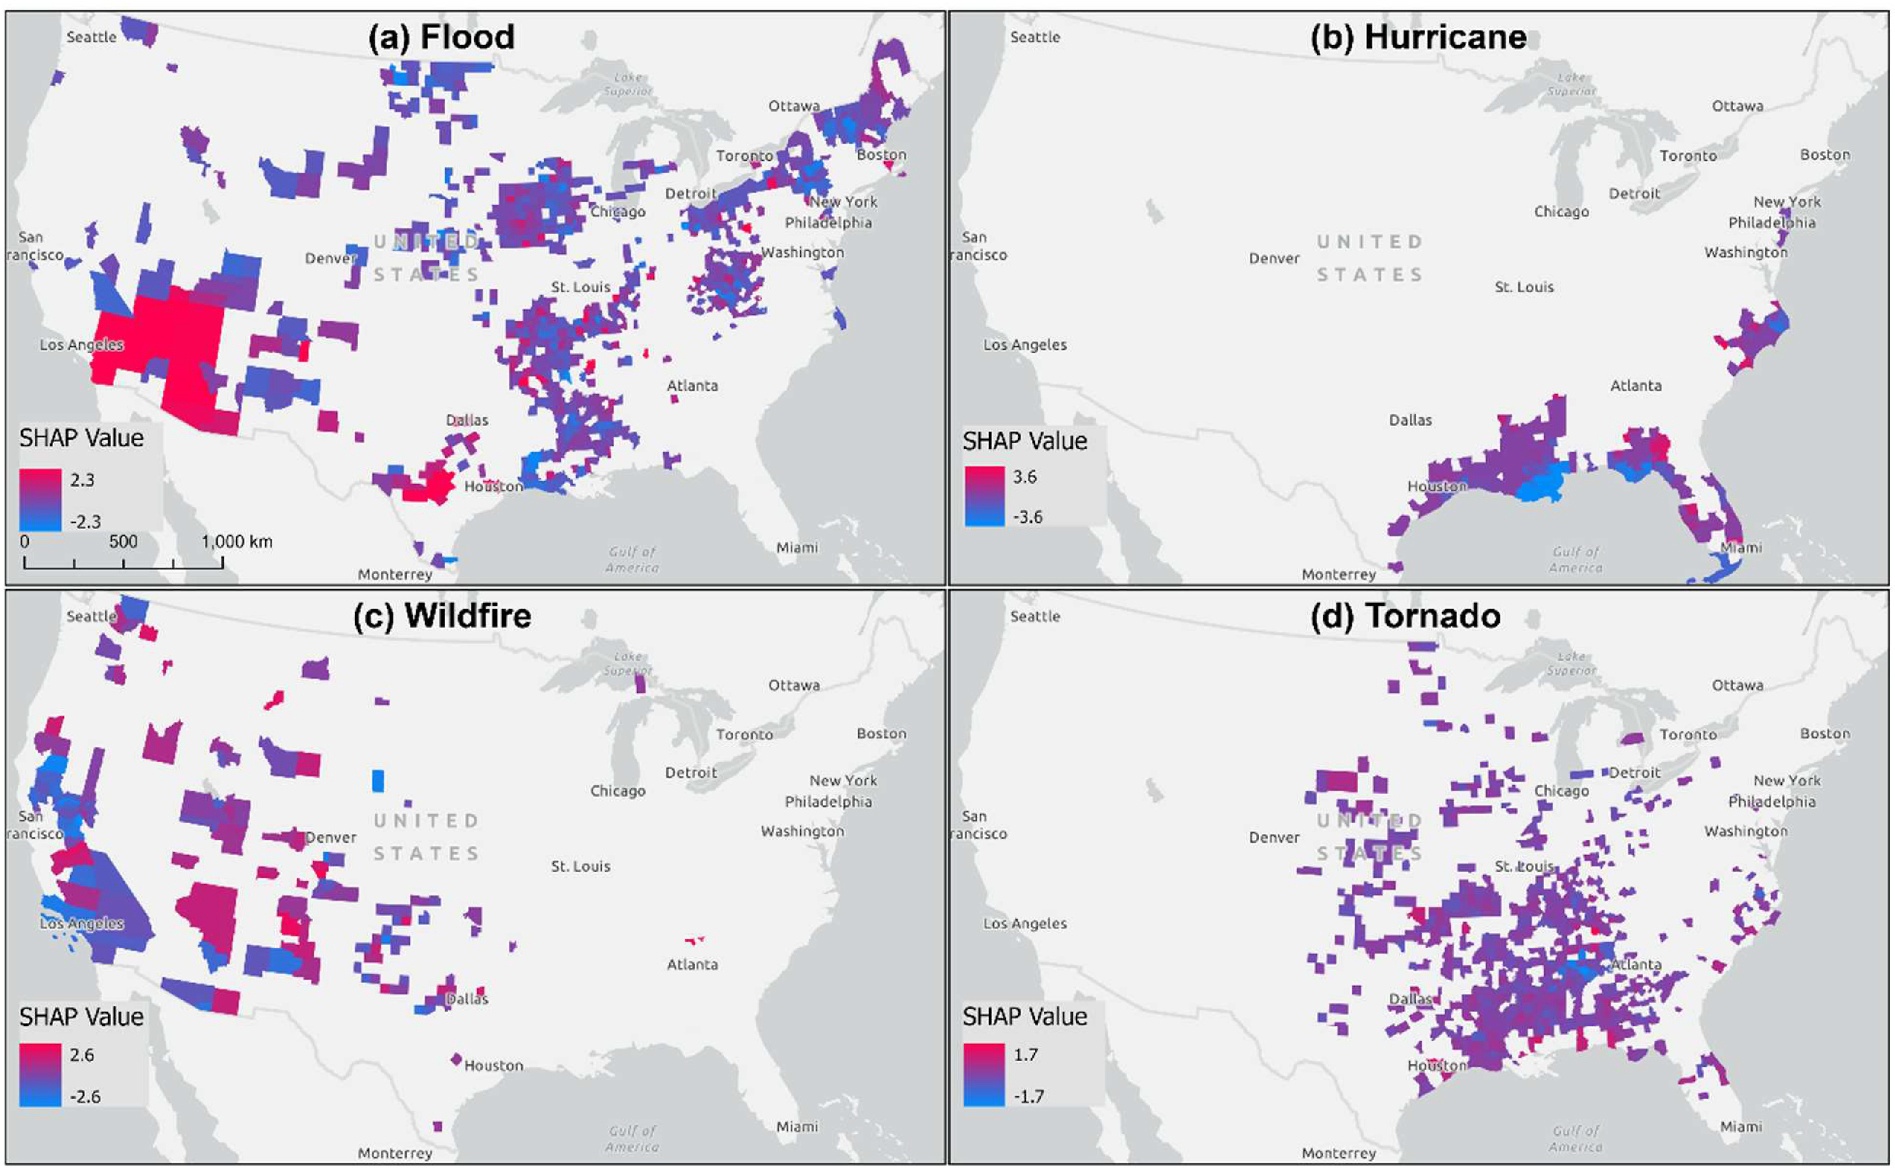
Fig. 6 maps the spatial distribution of SHAP values for disaster variables. The maps show that the contribution of disaster exposure is geographically uneven. Flood-related contributions are visible in parts of the West, Midwest, and eastern United States; hurricane contributions are concentrated along coastal regions; wildfire contributions are strongest in the West; and tornado contributions appear across the central and southeastern United States.
5. Contribution and innovation
This article contributes to climate migration and disaster resilience research in three ways.
First, it reframes disaster-related migration as a multi-factor process. The results show that disasters matter, but they work through local economic structure, housing conditions, vulnerability, and regional attractiveness. This helps explain why some hazard-prone areas continue to attract migrants.
Second, it combines short-term statistical analysis with long-term machine learning prediction. GAM captures nonlinear and lagged relationships, while AutoML evaluates predictive performance across multiple model families.
Third, it uses SHAP to make machine learning results interpretable. Instead of only reporting prediction accuracy, the study shows which variables drive model outputs and where disaster variables contribute spatially. This makes the analysis more useful for resilience planning, land-use policy, and targeted adaptation.
Overall, the article suggests that climate migration should be understood less as direct displacement from hazards alone and more as the outcome of interacting environmental shocks, socioeconomic opportunity, and local adaptive capacity.