Spatial Pattern and Socioeconomic Factors of 2022 Monkeypox Outbreak in the United States
08 Apr 2025Han, L., Qiang, Y., Ma, C., Li, X., Salim, Z., Bhandari, R., … & Jin, H. (2025). Spatial Pattern and Socioeconomic Factors of 2022 Monkeypox Outbreak in the United States. The Professional Geographer, 1-12.
1. The highlight of this article
-
This study presents the first county-level spatial analysis of the 2022 monkeypox (mpox) outbreak across five U.S. states.
-
It identifies significant spatial clustering of mpox infection rates and uncovers key socioeconomic and demographic factors (e.g., population density, same-sex male couples, minority racial groups) associated with infection rates.
-
The study emphasizes the disproportionate impact of mpox on marginalized communities and underscores the need for socially informed and geographically targeted public health responses.
2. Study area and dataset
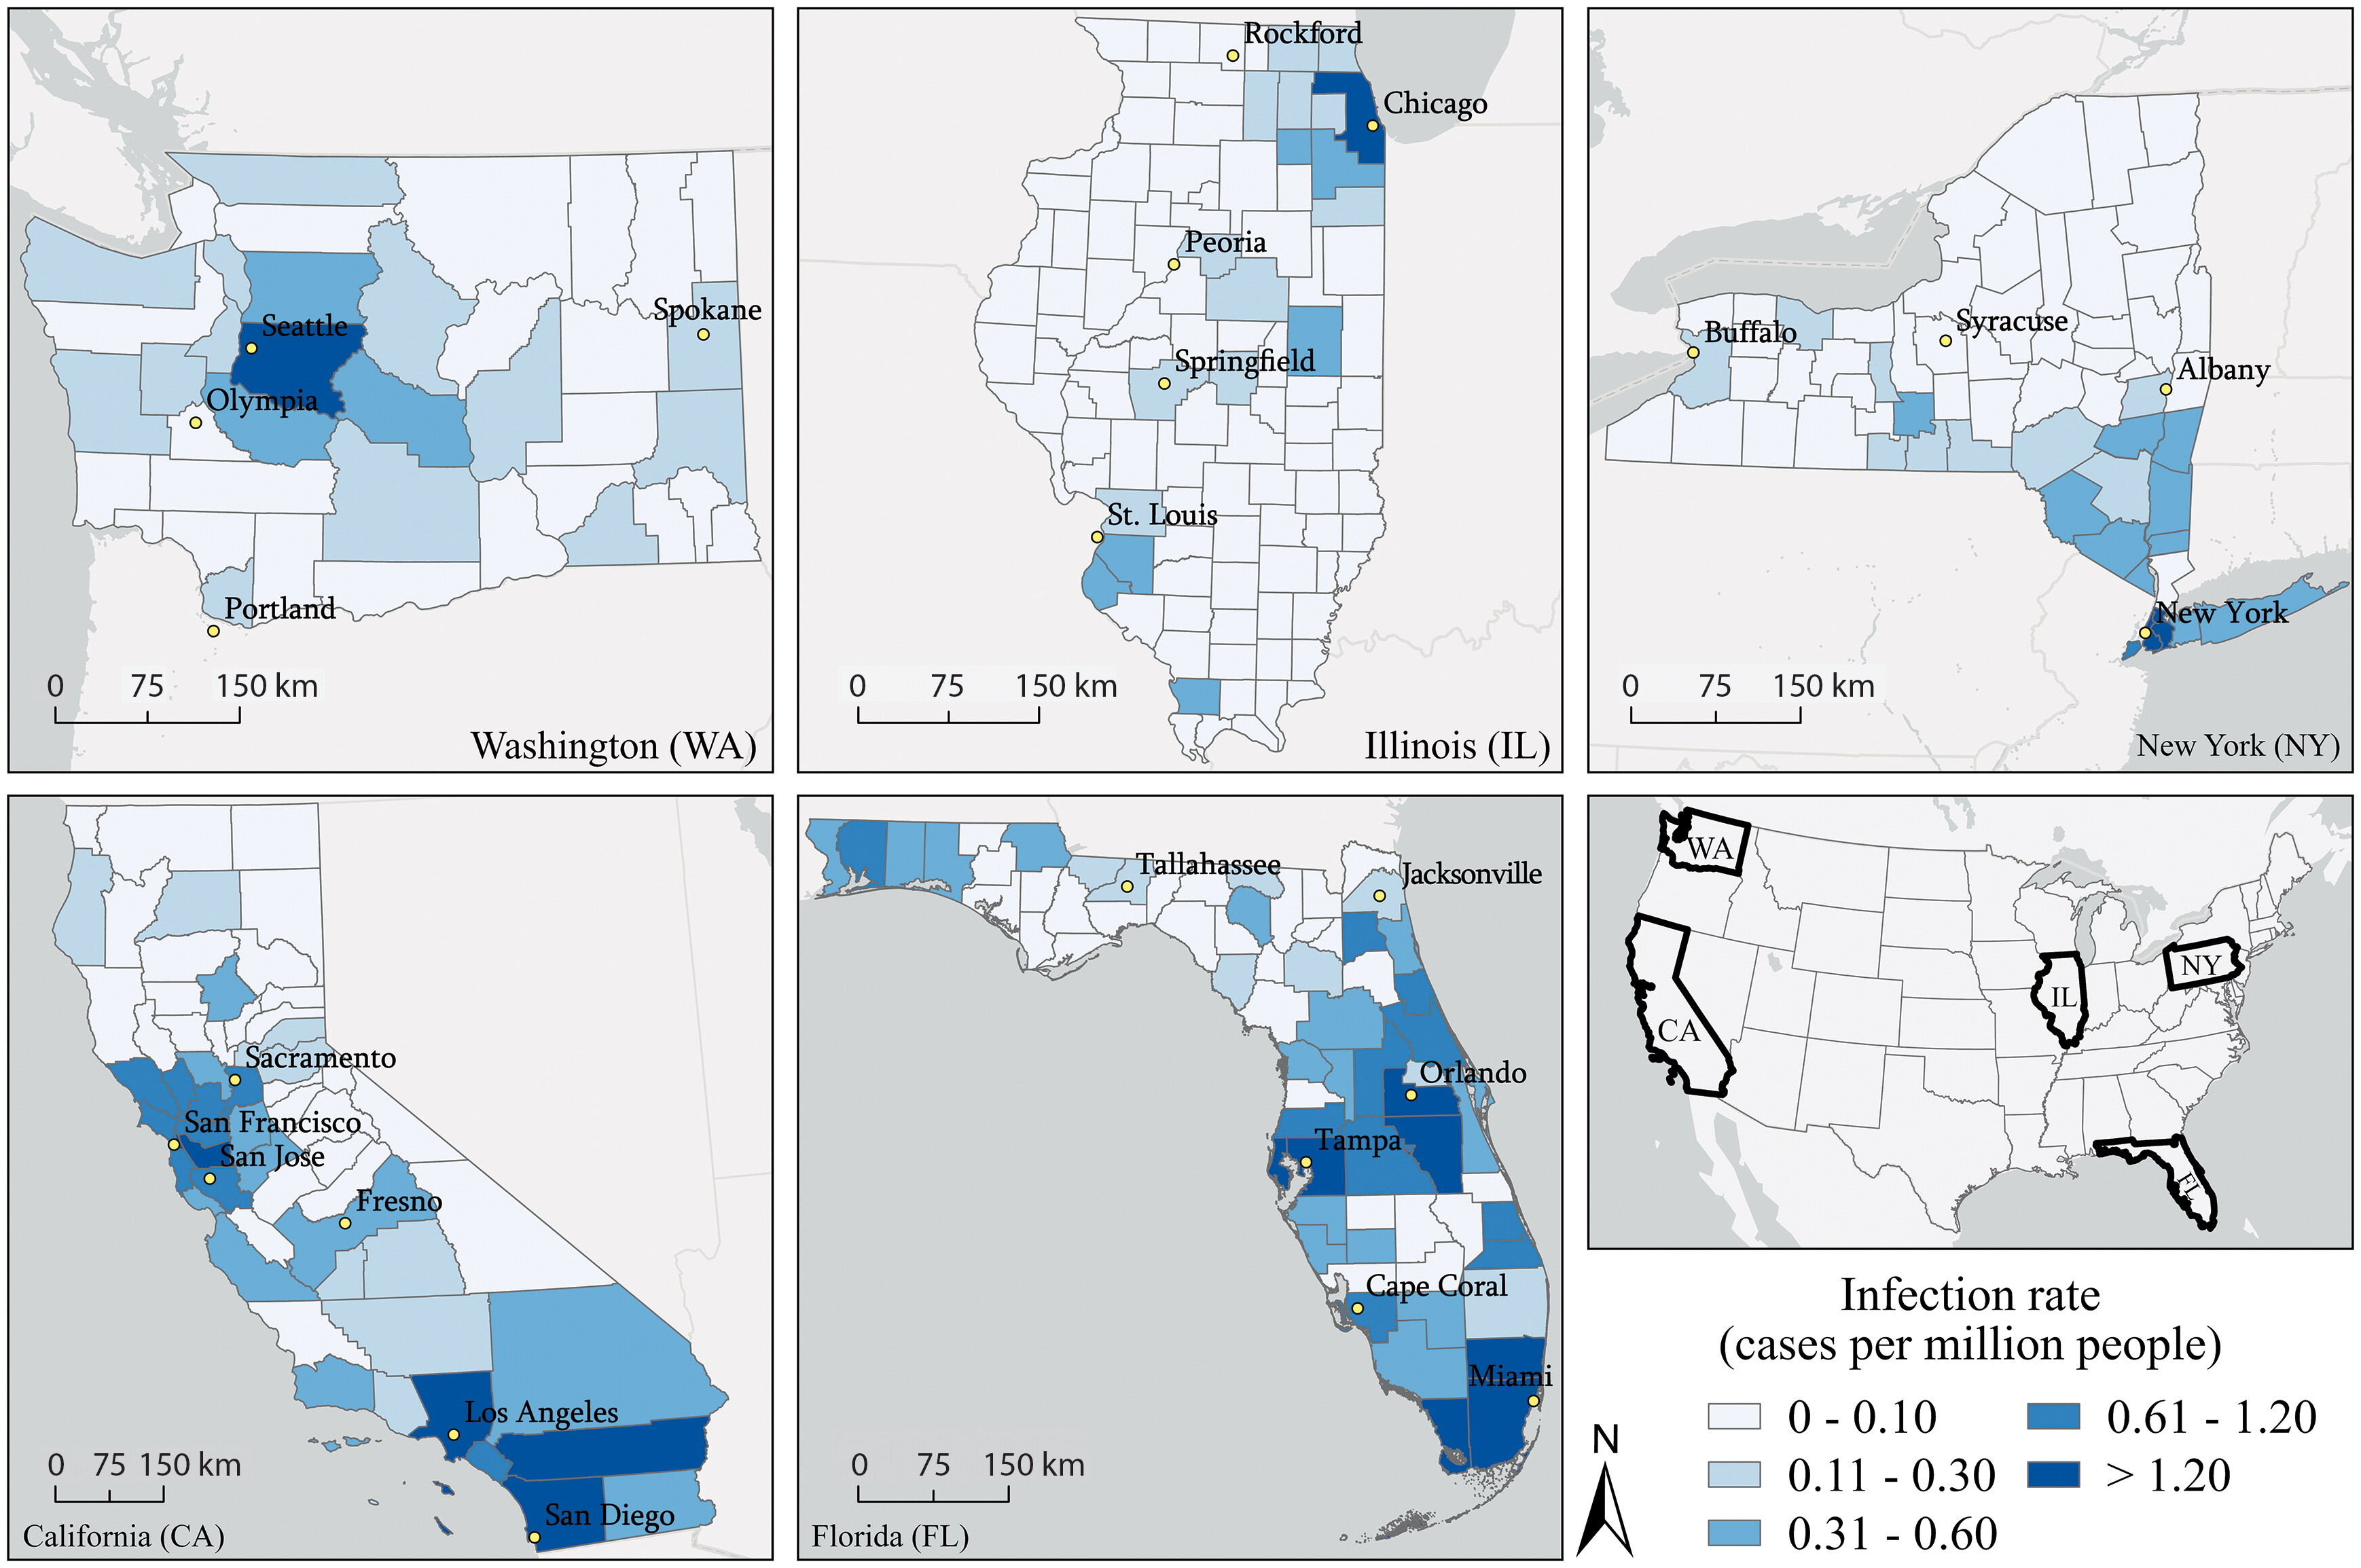
Study Area: Five U.S. states with county-level data — California, Florida, Illinois, New York, and Washington (total of 328 counties).
Time Period: May 10 to December 20, 2022.
Data Sources:
Mpox case data from state Departments of Health.
Socioeconomic and demographic data from the American Community Survey (ACS), CDC’s Social Vulnerability Index, and the Williams Institute (LGBTQ+ data).
Environmental data (temperature, humidity, precipitation, air quality) from NOAA and other sources.
Variables:
Dependent: Mpox cases per million.
Independent: 22 socioeconomic, demographic, and environmental variables (e.g., race, poverty, education, health insurance, same-sex couples).
3. Methods
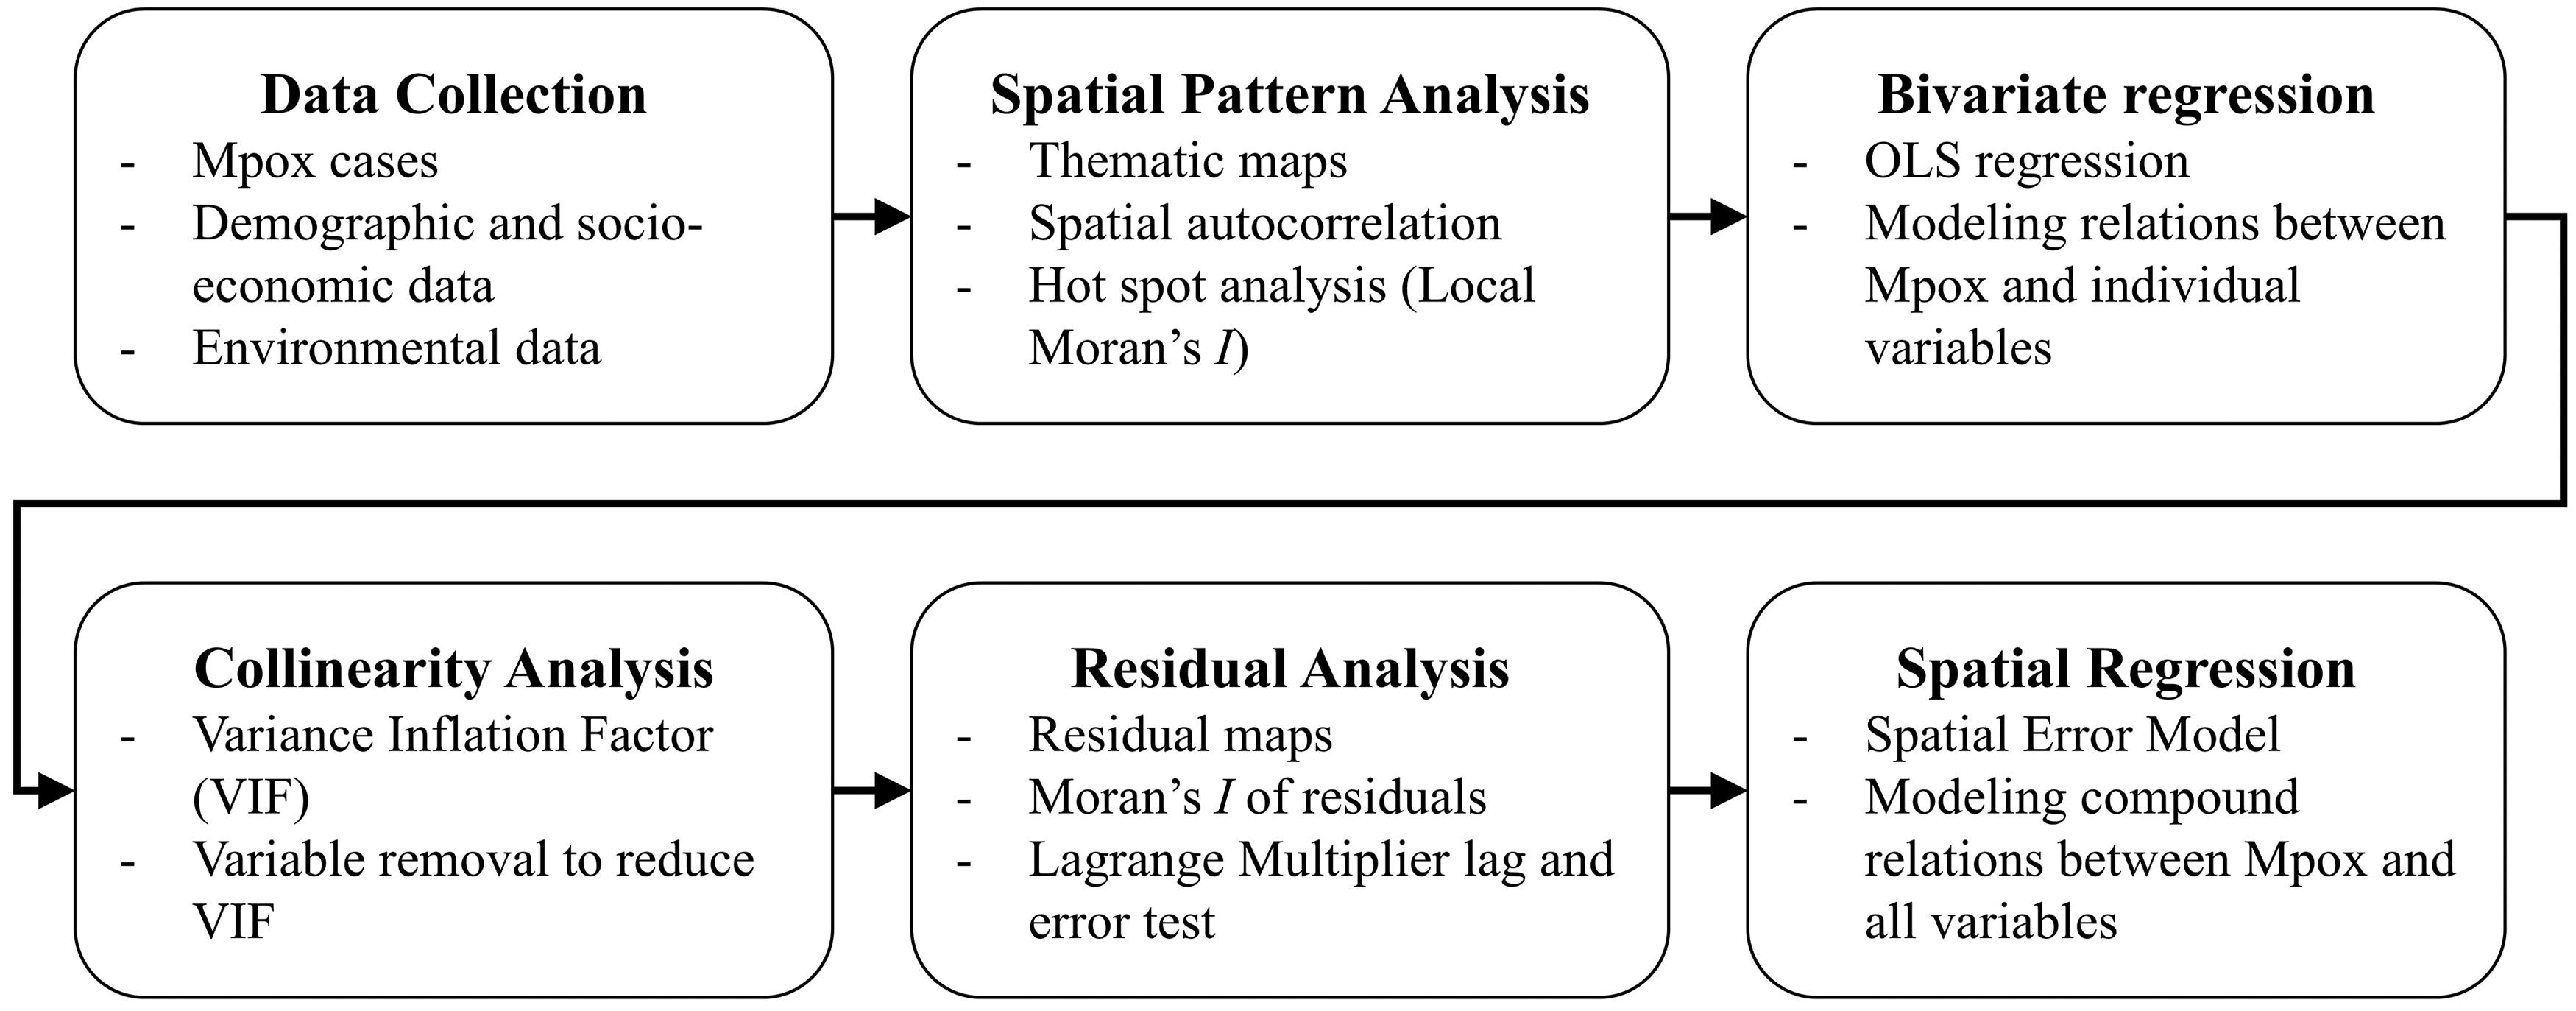
Spatial Analysis:
Global Moran’s I: Used to test for overall spatial autocorrelation in mpox rates.
Local Moran’s I: Identified local hot and cold spots of infection rates at 95% confidence.
Statistical Analysis:
Bivariate regression: Examined one-to-one relationships between mpox rates and each variable.
Multivariable regression:
Seventeen variables selected after removing those with high collinearity (VIF check).
Spatial error model was chosen over OLS based on diagnostics (significant residual Moran’s I and LM error test).
4. Results
Infection rates clustered in urban counties (e.g., NYC, Miami, San Francisco).
Hot spots concentrated in major metro areas; cold spots in rural regions.
Strong positive correlations with population density and male same-sex couples (each explaining >50% variance alone).
Mpox disproportionately affected Asian, Black, and Hispanic populations, negatively correlated with White population.
Model explained 85.9% of variance across all counties.
Significant predictors: population density, male same-sex couples, Black, Hispanic, and Asian population shares (positive), elderly population (negative).
State-specific variation was observed, e.g., income and education effects were more pronounced in Florida.


Policy Implications:
Findings advocate for tailored public health interventions, particularly in densely populated and minority-dominated areas.